If you are up to date on SEO and Web Performance, then without a doubt you know that Google has recently added new indicators to improve its evaluation of the browsing experience. These metrics are called the Core Web Vitals and we would like to discuss them with you.
What are Google’s Core Web Vitals?
The Core Web Vitals are a set of indicators linked to the speed, response time and visual stability of a web page. According to Google, these KPIs will help website owners evaluate the user experience more accurately.
Over time, these new indicators will have to be combined with existing factors such as having a website that is compatible with mobile browsing, providing a secure experience using the HTTPS protocol, or even the fact they do not impose intrusive interfaces.
The following scheme perfectly summarizes Google’s willingness to integrate Core Web Vitals into its existing KPIs as future metrics to evaluate the user experience:
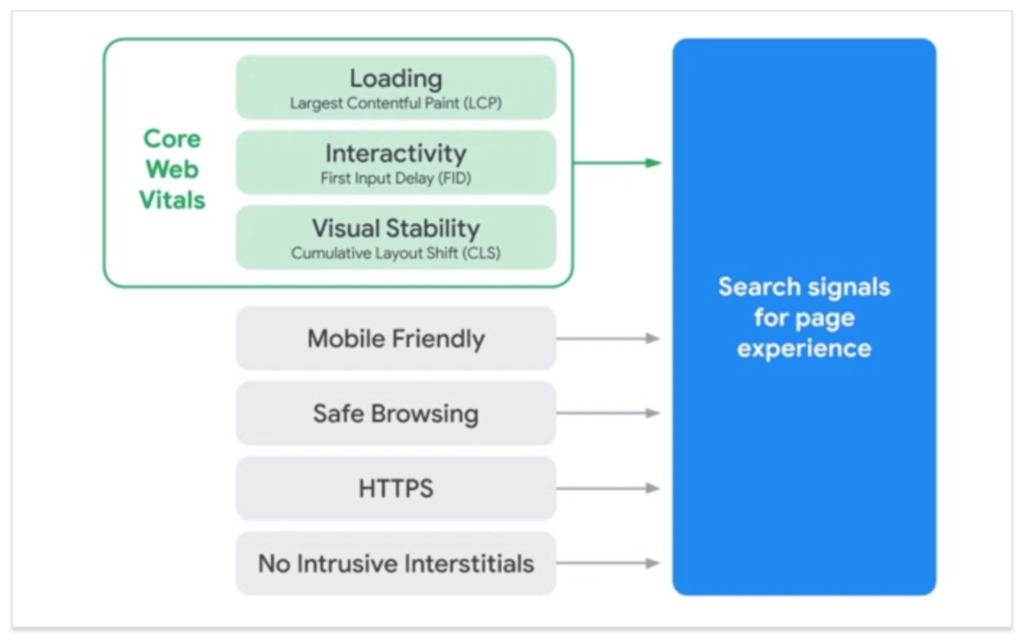
The Core Web Vitals are currently formed by 3 indicators, explained in detail below:
1. Largest Contentful Paint (LCP)
The Largest Contentful Paint measures the loading speed perceived by the user with the loading time calculation of the most important element seen on the screen.
It replaces existing indicators such as Load or the DOMContentLoaded, which did not take into account the concept of “screen visibility”.
Also, it is easier to understand than the First Meaningful Paint (FMP) and the Speed Index (SI), two quite complex indicators that we can still find in the Lighthouse tool.
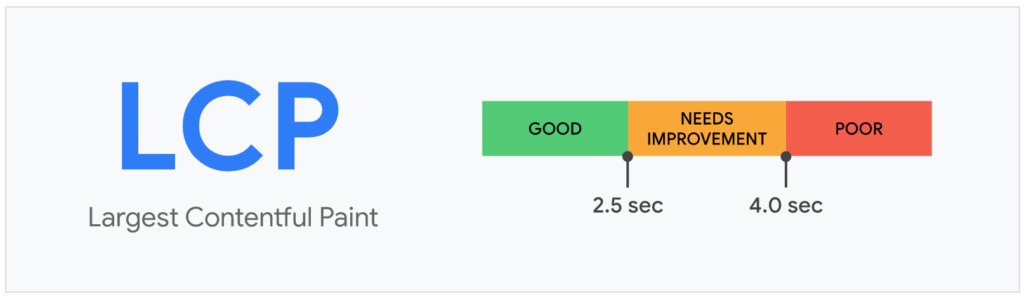
Google believes that a website must be able to display the most important element seen on the screen in the first 2.5 seconds to provide a good user experience.
In this loading time, the following are taken into account:
- The <img> elements
- The <image> elements within a <svg> tag
- The <video> elements
- Elements with an image loaded in the background through a url (_) function
- The text blocks
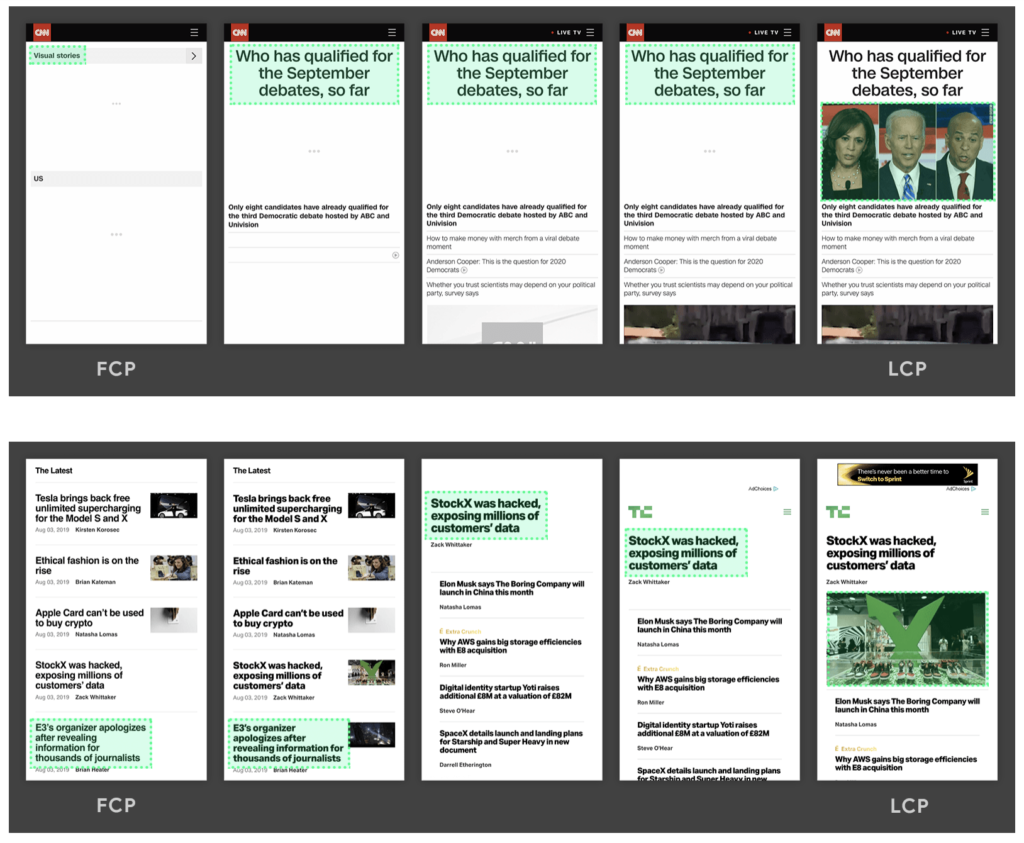
In these 2 examples, we observe the measurement of the LCP after showing the largest element seen on the screen; in this particular case, the two main images:
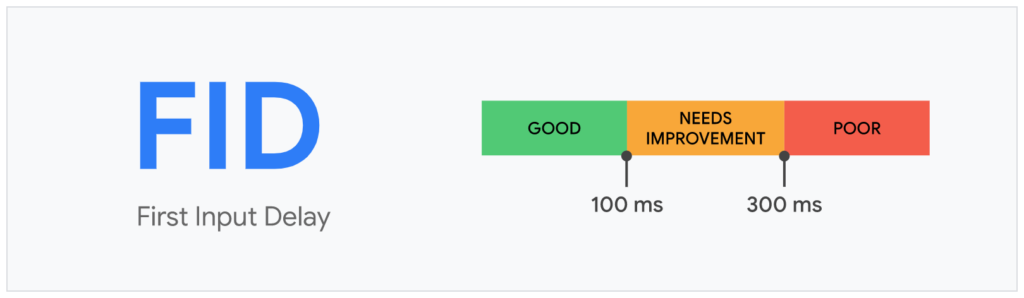
2. First Input Delay (FID)
The First Input Delay measures the time frame needed before the user can interact. Google recommends having a FID under 100 milliseconds.
This indicator is the real first impression your website’s responsiveness will make on the user. As in every field, first impressions are often crucial.
The FID takes special account of actions such as clicks, keystrokes and “taps” on the mobile version.
3. Cumulative Layout Shift (CLS)
The last indicator, the Cumulative Layout Shift, will be focused on measuring the visual stability of your website.
Here we refer to the frequency with which users experience an unexpected change in the page’s format.
The lower the score, the more enjoyable the navigation will be.
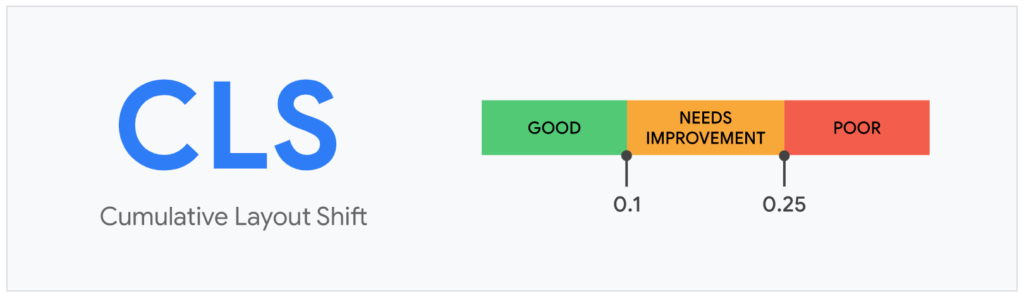
The CLS reflects the sum of all individual scores for changes in the page format from every unanticipated variation that occurs during the life of the page. This score must be lower than 0.1.
To calculate individual scores, Google uses the following formula:
layout shift score = impact fraction * distance fraction
For example, if within a page there is a block of text that scrolls down to display another element, Google will measure the Impact Fraction, meaning, the union of the visible areas in all the unstable elements of the previous and current image.
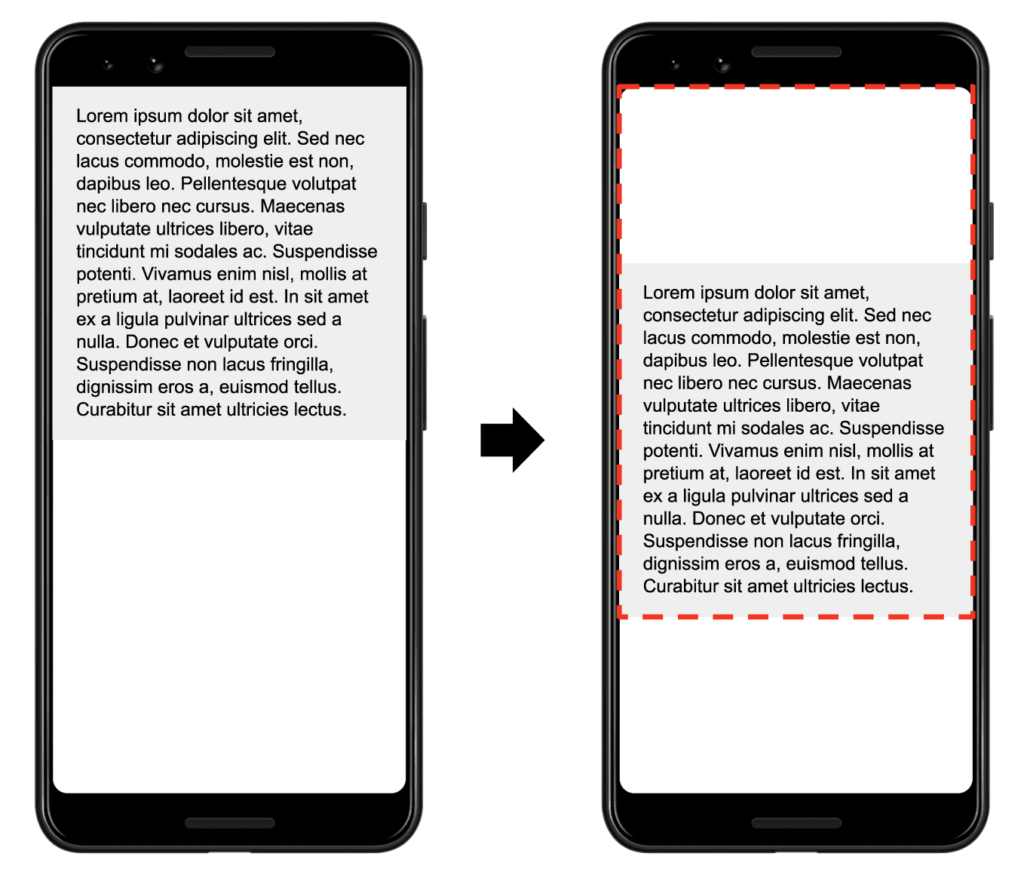
In the image above, there is a text element that takes up half of the visible part of the screen. Then, in the following picture, the element is moved down by 25% from the screen height. The red dotted rectangle indicates the combination of the element’s visible area in the two environments, which, in this case, occupies 75% of the total screen, therefore its Impact Fraction will be 0.75.
Always based on the Google example, the largest dimension of the screen is the height, and the unstable element has displaced the height of the screen by 25%, resulting in a distance fraction of 0.25.
Thus, in the example, the Impact Fraction is 0.75 and the Distance Fraction is 0.25. Therefore, the scrolling score for the page format is 0.75 * 0.25 = 0.1875.
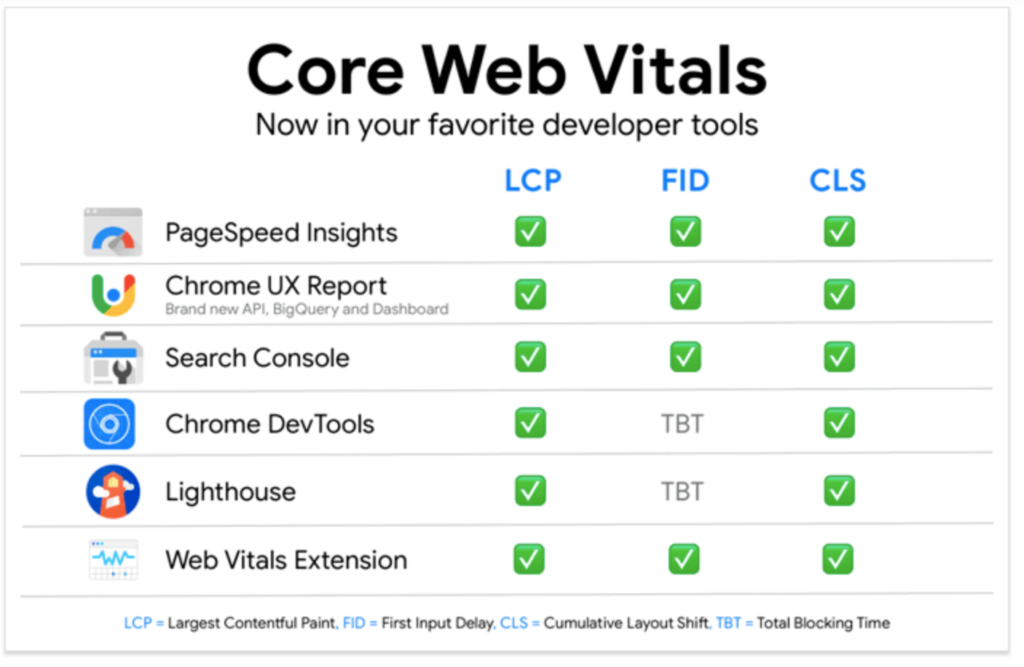
Where can you find the Core Web Vitals?
You can find these three indicators in the tools that Google offers for free.
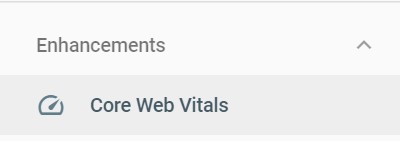
Especially in your website’s Google Search Console, which will now display your page loading time indicators in the Enhancements > Core Web Vitals section.
How to approach these new indicators?
Although the website ranking algorithm does not include these indicators at the moment, it is important to consider them as an additional toolbox that helps improve user experience, as well as gaining positions in the SERPs.
At Labelium we have already fully integrated these new KPIs into our methodology, both in the audit phase and in our web performance monitoring dashboards for our clients.